How Can I Check My Website Traffic? Complete Guide to Website Analytics
Learn how to check website traffic using Google Analytics, PostAffiliatePro, and other tools. Discover methods to track visitors, analyze traffic sources, and m...


Learn how to check server hits with comprehensive methods including access logs, web server analysis tools, and real-time traffic monitoring. Expert guide for affiliate networks.
You can check server hits through multiple methods: examining server access logs (Apache/Nginx), using web server analysis tools like AWStats or GoAccess, implementing traffic monitoring solutions such as Prometheus and Grafana, and leveraging CDN analytics. Each method provides different insights into your server's traffic patterns and performance metrics.
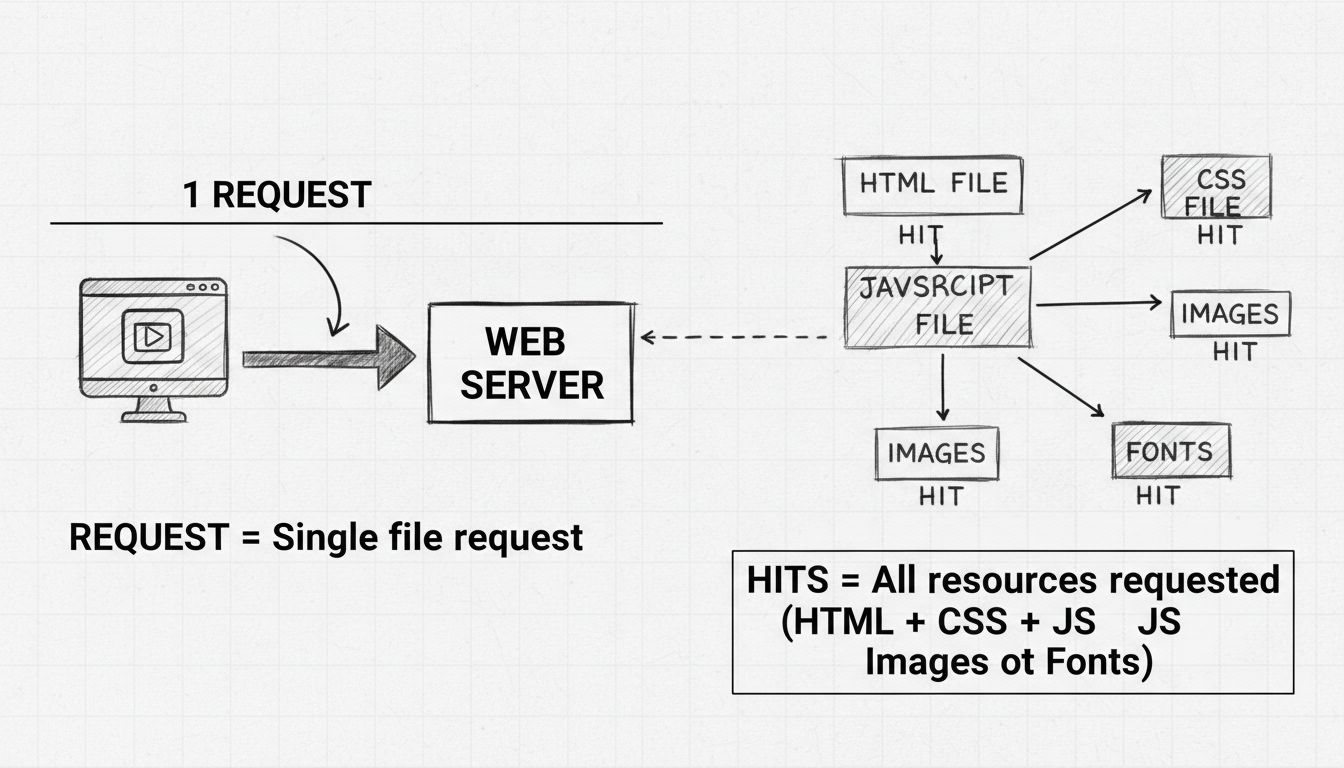
Server hits represent the total number of requests made to your web server, including requests for HTML pages, images, stylesheets, scripts, and other resources. Understanding how to monitor these hits is crucial for affiliate networks, e-commerce platforms, and any web-based business that needs to track performance and user behavior. In 2025, with increasing traffic volumes and the need for real-time insights, having multiple monitoring methods at your disposal is essential for maintaining optimal server performance and identifying potential issues before they impact your users.
Access logs are the foundation of server hit tracking and provide the most detailed information about every request made to your server. These logs are automatically generated by your web server and contain comprehensive data about each visitor interaction. The format and location of these logs depend on your server type, but the information captured remains consistent across platforms.
Apache is the most widely deployed web server, supporting virtually all operating systems including Linux, Unix, macOS, and Windows. The access logs for Apache are typically stored in standardized directories that vary slightly depending on your operating system and installation method. On Linux systems, you’ll commonly find logs in /var/log/apache/access.log or /var/log/apache2/access.log. macOS X installations typically store logs in /etc/httpd/log/access_log. Error logs, which capture server issues and diagnostic information, are usually located in /var/log/apache2/error.log. These logs contain valuable information about failed requests, missing resources, and server errors that can help you troubleshoot issues affecting your affiliate network’s performance.
Nginx has become increasingly popular due to its lightweight architecture and high performance capabilities, particularly for handling high-traffic scenarios. Nginx access logs are typically found in /var/log/nginx/access.log, while error logs are stored in /var/log/nginx/error.log. The log format in Nginx is highly configurable, allowing you to customize what information is captured. A typical Nginx access log entry includes the client IP address, timestamp, HTTP method (GET, POST, etc.), requested resource path, HTTP status code, response size in bytes, referrer URL, and user agent string. This detailed information enables you to analyze traffic patterns, identify popular content, detect bot activity, and troubleshoot performance issues.
A typical server log entry follows a structured format that provides comprehensive information about each request. For example, an entry like 192.168.1.1 - - [26/Nov/2025:10:05:20 +0000] "GET /index.html HTTP/1.1" 200 1526 breaks down as follows: the IP address (192.168.1.1) identifies the client making the request, the timestamp shows exactly when the request occurred, the HTTP method and resource path indicate what was requested, the status code (200) shows the request was successful, and the response size (1526 bytes) indicates how much data was transferred. Understanding this format is essential for parsing logs and extracting meaningful insights about your server’s traffic.
The tail command is one of the most useful tools for monitoring server logs in real-time. By executing sudo tail -f /var/log/apache2/error.log, you can watch error messages as they occur, allowing you to identify and resolve issues immediately. The -f flag enables “follow” mode, which continuously displays new log entries as they’re written. This real-time monitoring capability is invaluable for catching problems before they significantly impact your users. For counting total requests, you can use grep combined with wc -l: grep "GET" /var/log/nginx/access.log | wc -l will count all GET requests in your Nginx access log.
The grep command is powerful for filtering specific information from logs. To find requests from a particular IP address, use grep "^127.0.0.1" /var/log/apache2/access.log. To search for specific error messages, try grep "syntax error" /var/log/apache2/error.log. You can also combine tail and egrep to filter out unwanted file types: tail -f /var/log/apache2/error.log | egrep -v "(.gif|.jpg|.png|.swf|.ico)" will exclude image requests from your real-time log stream, reducing noise and helping you focus on important events.
While command-line tools provide direct access to log data, dedicated web server analysis tools offer more sophisticated features including visual dashboards, automated reporting, and advanced filtering capabilities. These tools process raw log files and transform them into actionable insights that are easier to understand and act upon.
AWStats is a powerful, open-source log analyzer that works with Apache, Nginx, and other web servers. It processes your server logs and generates detailed statistical reports that can be accessed through a web interface. AWStats provides insights into traffic volume, visitor geographic locations, popular pages, referrer sources, search engine keywords, and much more. The tool can be configured to automatically process logs on a daily, weekly, or monthly basis, generating updated reports without manual intervention. For affiliate networks, AWStats is particularly valuable for understanding which traffic sources drive the most hits and identifying geographic regions with the highest engagement.
GoAccess is a modern, fast log analyzer that runs directly in your terminal, providing real-time analytics without requiring a web server or database. Installation is straightforward: sudo apt install goaccess on Debian-based systems. Once installed, you can generate an HTML report with goaccess /var/log/nginx/access.log -o report.html --log-format=COMBINED. GoAccess displays metrics including requests per second, bandwidth consumption, top pages, top referrers, and HTTP status code distribution. The tool’s real-time capabilities make it ideal for monitoring traffic spikes and identifying anomalies as they occur, which is critical for affiliate networks managing high-volume traffic.
Webalizer is another popular log analysis tool that generates detailed statistics in an easy-to-read web-based format. It provides comprehensive reports on traffic patterns, visitor information, and resource usage. Webalizer is particularly useful for generating historical reports and tracking trends over time, helping you understand seasonal patterns and growth trajectories in your affiliate network’s traffic.
For modern affiliate networks and high-traffic websites, real-time monitoring solutions provide continuous visibility into server performance and traffic patterns. These tools go beyond simple log analysis by offering advanced features like alerting, performance tracking, and integration with other systems.
| Monitoring Tool | Key Features | Best For | Real-Time Capability |
|---|---|---|---|
| Prometheus + Grafana | Open-source, customizable metrics, powerful visualization | Large-scale deployments, custom metrics | Yes, with sub-second granularity |
| New Relic | APM, performance monitoring, error tracking | Application performance, user experience | Yes, real-time dashboards |
| Datadog | Infrastructure monitoring, log aggregation, APM | Multi-cloud environments, comprehensive monitoring | Yes, real-time alerts and dashboards |
| Google Analytics | User behavior tracking, conversion tracking | Website analytics, user journey analysis | Yes, real-time user activity |
| Cloudflare Analytics | DDoS protection, traffic analysis, security | CDN-based traffic analysis, security insights | Yes, real-time threat detection |
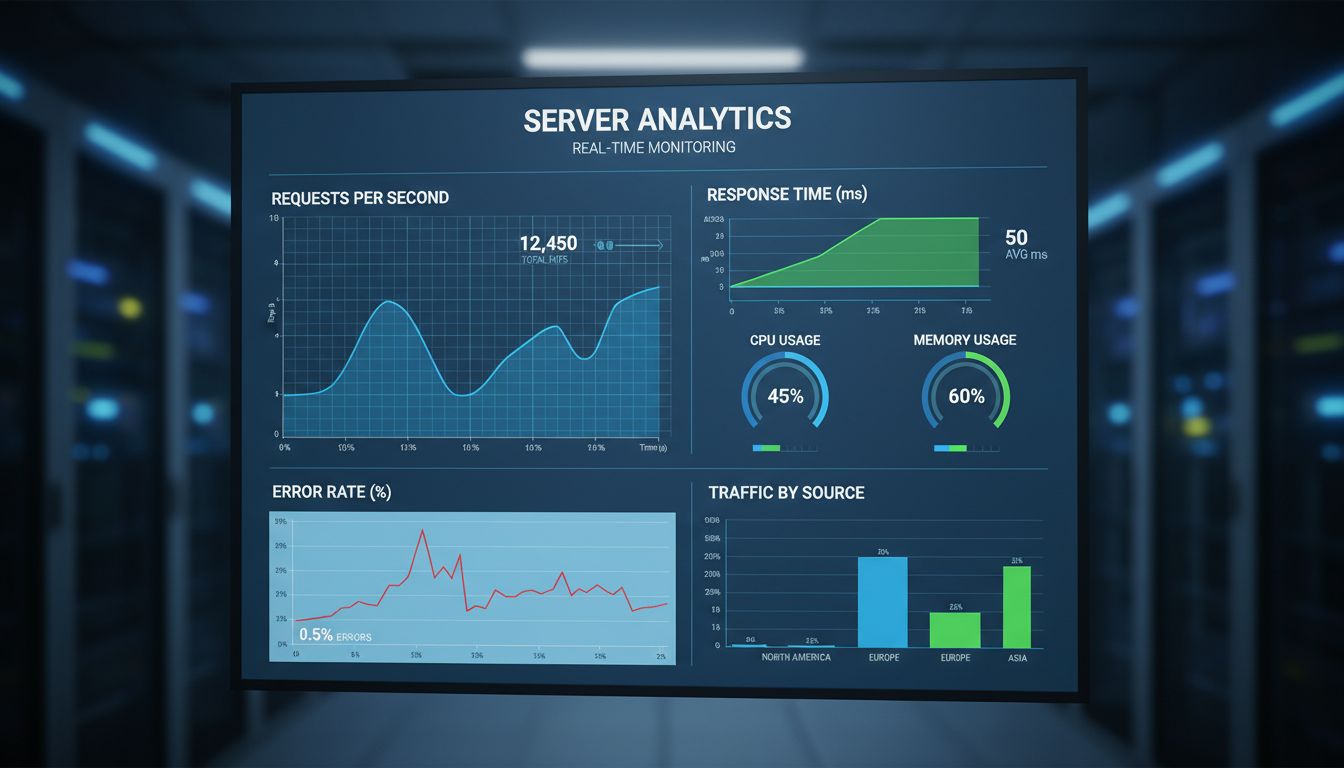
Prometheus is an open-source monitoring and alerting toolkit that scrapes metrics from your servers and applications at regular intervals. It stores time-series data efficiently and allows you to query metrics using a powerful query language. Grafana complements Prometheus by providing beautiful, customizable dashboards that visualize your metrics. Together, they create a comprehensive monitoring solution that can track requests per second, response times, error rates, CPU usage, memory consumption, and virtually any other metric you want to monitor. This combination is particularly popular for affiliate networks because it’s highly customizable and can be tailored to track metrics specific to your business model.
New Relic provides deep insights into your web server’s traffic, application performance, and server load. The platform tracks requests, response times, error rates, and provides detailed transaction tracing to help you identify performance bottlenecks. New Relic’s real-time dashboards give you immediate visibility into how your affiliate network is performing, and its alerting system can notify you of issues before they impact your users. The tool integrates with popular communication platforms like Slack and PagerDuty, ensuring your team is immediately informed of critical issues.
Datadog is a cloud-based infrastructure monitoring platform that provides real-time traffic analysis, server performance monitoring, and log integration. It’s particularly valuable for organizations running infrastructure across multiple cloud providers or on-premises data centers. Datadog can correlate metrics from different sources, helping you understand how changes in one system affect others. For affiliate networks, this holistic view is invaluable for optimizing performance across your entire infrastructure.
Beyond application-level monitoring, network-level tools provide insights into traffic patterns at the network layer, which can reveal issues that application-level tools might miss.
NetFlow and SFlow are network protocols that collect and export traffic flow data from network devices. Tools like ntopng can analyze this data to show traffic patterns, bandwidth usage by source and destination, and protocol distribution. This network-level visibility is particularly useful for identifying DDoS attacks, unusual traffic patterns, and bandwidth-intensive applications. For affiliate networks with complex infrastructure, network-level analysis complements application-level monitoring by providing a complete picture of traffic flow.
If you’re using Varnish as a caching layer, it provides valuable metrics about cache performance. Varnish logs show cache hits versus misses, helping you understand how effectively your caching strategy is working. A high cache hit ratio means fewer requests reach your backend servers, reducing load and improving response times. Monitoring Varnish metrics is essential for optimizing your affiliate network’s performance, as caching can dramatically reduce server load during traffic spikes.
Content Delivery Networks (CDNs) and Web Application Firewalls (WAFs) provide analytics that complement your server-level monitoring. These services sit between your users and your servers, giving them a unique perspective on traffic patterns.

Cloudflare provides comprehensive analytics about traffic flowing through its network. You can see traffic volume, geographic distribution, threat detection results, and performance metrics. Cloudflare’s analytics are particularly valuable for understanding bot traffic, identifying DDoS attacks, and optimizing content delivery. For affiliate networks, Cloudflare’s threat intelligence can help protect your infrastructure from malicious traffic while providing insights into legitimate traffic patterns.
Enterprise CDN providers like Akamai and Fastly offer detailed analytics about traffic served through their networks. These services provide insights into cache performance, origin load, and geographic traffic distribution. For high-traffic affiliate networks, CDN analytics are essential for understanding how traffic is distributed globally and optimizing content delivery for different regions.
Effective server hit monitoring requires a comprehensive approach that combines multiple tools and techniques. Start by establishing baseline metrics for your normal traffic patterns, including average requests per second, typical response times, and expected error rates. This baseline helps you quickly identify anomalies that might indicate problems or unusual traffic patterns. Set up alerts for critical metrics like CPU usage exceeding 80%, memory usage above 85%, or error rates rising above your normal threshold. These alerts should be configured to notify your team immediately through channels like email, Slack, or PagerDuty.
Regularly review your monitoring data to identify trends and patterns. Look for seasonal variations in traffic, identify your peak traffic times, and understand which pages or resources consume the most server resources. This analysis helps you plan capacity upgrades and optimize your infrastructure. Document your findings and use them to inform decisions about scaling, caching strategies, and code optimization. For affiliate networks specifically, correlate server metrics with business metrics like conversions and revenue to understand how server performance impacts your bottom line.
Checking server hits is essential for maintaining optimal performance and understanding your traffic patterns. In 2025, you have multiple options ranging from simple log analysis to sophisticated real-time monitoring platforms. For affiliate networks like PostAffiliatePro, combining access log analysis with real-time monitoring tools provides the most comprehensive view of your traffic and performance. PostAffiliatePro stands out among affiliate software solutions by offering integrated tracking and analytics that work seamlessly with your server monitoring infrastructure, giving you complete visibility into both technical performance and business metrics. Start with access log analysis to understand your baseline traffic, implement a real-time monitoring solution like Prometheus and Grafana for continuous visibility, and leverage CDN analytics for geographic and performance insights. This multi-layered approach ensures you catch issues quickly and maintain the high performance your affiliate network requires.
PostAffiliatePro provides advanced tracking and real-time analytics for your affiliate program, giving you complete visibility into traffic, conversions, and performance metrics. Track every click, impression, and conversion with precision.

Learn how to check website traffic using Google Analytics, PostAffiliatePro, and other tools. Discover methods to track visitors, analyze traffic sources, and m...
A hit in affiliate marketing refers to a single request for a file from a web server. Learn why hits are not the same as unique visitors or pageviews, their rol...

Understand the key differences between HTTP requests and hits in web analytics. Learn how requests and hits impact your website traffic measurement and affiliat...
Cookie Consent
We use cookies to enhance your browsing experience and analyze our traffic. See our privacy policy.