How to Calculate Return on Investment (ROI)
Learn how to calculate ROI with step-by-step formulas, real-world examples, and advanced techniques. Master return on investment calculations for better financi...
10 min read

Calculate how long it takes to recover your investment through cash flows. Analyze simple and discounted payback periods to make informed investment decisions and prioritize projects effectively.
Payback Period Basics - Payback period measures investment recovery speed, not profitability. A 2-year payback means you recover your initial investment in 2 years from the project’s cash generation. After payback, the project generates positive cash flow. This metric is intuitive (easy to explain to non-financial stakeholders), focuses on liquidity (how quickly capital becomes available again), implies risk (longer payback = more time for things to go wrong), and provides simple comparison (evaluate multiple projects quickly). However, it ignores total profitability - a 1-year payback generating $50K total is worse than a 3-year payback generating $500K total.
Cash Flow vs. Accounting Profit - Critical distinction: payback period uses cash flow, not accounting profit. Cash flow includes: actual cash received from customers, actual cash paid to suppliers and employees, capital expenditures (equipment, technology purchases), working capital changes (inventory, receivables), and excludes non-cash items (depreciation, amortization). Example: Project shows $100K accounting profit including $30K depreciation. Cash flow is $130K ($100K + $30K non-cash expense). Use cash flow for payback calculations because cash is what you need to recover, not accounting profit. Many profitable projects fail due to cash flow problems.
Time Value of Money - Simple payback treats all dollars equally regardless of when received. Reality: $1 today is worth more than $1 next year due to inflation, investment opportunity cost, and risk. Discounted payback period adjusts future cash flows to present value using discount rate (required return, typically 8-15%). This provides more accurate payback assessment, especially for long-term investments. Most businesses use simple payback for quick screening (reject anything over 3 years) then use discounted payback and NPV for detailed analysis of remaining candidates. The longer the payback period, the more time value matters.
Payback as Screening Tool - Use payback period to quickly filter investment opportunities. Establish criteria: must payback within 2 years (aggressive growth focus), within 3 years (balanced approach), or within 5 years (patient capital, long-term assets). Apply consistently to all projects. Projects failing payback threshold are rejected immediately unless strategic reasons justify exception (market entry, competitive defense, regulatory requirement). Passing projects advance to detailed analysis (NPV, IRR, sensitivity analysis). This screening saves analysis time by eliminating obvious non-starters. However, don’t let arbitrary thresholds reject genuinely great long-term opportunities.
Risk Assessment - Payback period is proxy for project risk. Shorter payback = less risk exposure. Risk factors that extend payback: market uncertainty (unproven demand), technology risk (new, untested technology), execution risk (complex implementation), competitive risk (competitors might respond), regulatory risk (rules might change), and cash flow volatility (unpredictable cash generation). Adjust required payback based on risk: low-risk projects (proven model, stable market) can have longer acceptable payback, high-risk projects (new markets, new technology) need very short payback (1-2 years maximum). Risk-adjusted payback helps compare projects with different risk profiles.
Capital Budgeting - Businesses with limited capital must prioritize investments. Payback period helps allocate scarce resources. Process: identify all potential investments, calculate payback for each, rank by payback (shortest first), fund projects until capital exhausted, reject remaining projects. Refinements: group by strategic importance (must-do vs. nice-to-have), weight by payback and profitability (don’t use payback alone), phase large projects (implement in stages), and revisit quarterly (reassess as situations change). Fast-payback projects free capital for additional investments, creating compounding effect. Slow-payback projects tie up capital, limiting flexibility.
Growth Investment Strategy - High-growth businesses prioritize fast capital recycling. Invest in short-payback initiatives, recover capital quickly, reinvest in next opportunity, and repeat. This strategy maximizes growth rate when capital is constrained. Example: $100K invested in 1-year payback project returns $100K annually. After 1 year, reinvest original $100K plus $100K profit in two more 1-year projects. After 2 years, you have four projects generating $400K annually. Same $100K in 4-year payback project just breaks even at year 4. Short payback compounds growth. However, don’t sacrifice great long-term opportunities for mediocre short-term wins. Balance payback speed with ultimate profitability.
Calculate payback for capital equipment purchases. Formula: Equipment Cost / (Cost Savings + Revenue Increase). Example: $50K machine reduces labor costs $15K/year and increases capacity generating $10K additional profit = $25K annual benefit. Payback: 2 years. Include all costs: purchase price, installation, training, maintenance, and ongoing costs. Include all benefits: cost savings, revenue increases, quality improvements (reduce waste/returns), and productivity gains. Most equipment should payback in 2-4 years. Technology equipment needs faster payback (18-24 months) due to rapid obsolescence.
Track payback for marketing investments. Calculate: Campaign Cost / Incremental Profit per Period. Example: $20K campaign generating $5K additional monthly profit has 4-month payback. Track separately by channel: paid ads (immediate to 3-month payback typical), content marketing (6-12 month payback), SEO (12-24 month payback), brand campaigns (24-36 month payback). Successful marketing has clear attribution and measurable payback. Stop campaigns with 6+ month payback unless strategic (brand building, market entry). Scale campaigns with 1-3 month payback aggressively. Use customer lifetime value for full picture - initial payback plus long-term profit.
New hires have payback periods. Calculate: (Salary + Benefits + Overhead) / Annual Profit Contribution. Example: sales rep costs $80K total (salary $60K, benefits $15K, overhead $5K), generates $40K profit margin annually = 2-year payback. Reality check: new hires take 3-6 months to fully ramp, so year-one contribution might be only $20K, extending payback to 3+ years. Include ramp time in payback calculations. Revenue-generating roles (sales, customer success) should payback within 1-2 years. Support roles (operations, admin) improve efficiency but have longer/harder-to-measure payback.
Software investments should payback through time savings or revenue increase. Calculate: Annual Software Cost / (Time Saved × Hourly Cost + Revenue Increase). Example: $6K annual software saves 5 hours/week (260 hours/year × $50 loaded cost = $13K value) and improves conversion 10% generating $5K additional profit = $18K annual benefit. Payback: 4 months. Automation and software typically payback within 6-12 months. Longer payback acceptable for mission-critical systems (accounting, CRM). Cancel subscriptions not reaching payback within 12 months unless strategic dependency exists.
Content assets have long payback curves. Calculate: Content Creation Cost / Monthly Traffic Value. Example: $2K article drives 1,000 monthly visitors worth $3/visitor (based on conversion rates) = $3K monthly value, 0.67-month payback. Reality: SEO content takes 6-12 months to rank, so actual payback is 6-12 months. Evergreen content continues generating value for years after payback. Video content has higher upfront costs ($5K-20K) but longer value generation (3-5 years). Calculate lifetime value: content generating $500/month for 3 years = $18K total value from $2K investment (9X return, 4-month payback).
New market entry has significant upfront investment: market research, localization, initial inventory, marketing, local partnerships, and regulatory compliance. Calculate: Total Entry Costs / Projected Annual Profit from Market. Example: $200K entry cost, $80K projected annual profit = 2.5-year payback. Risk factors: market might not accept product, cultural differences, regulatory challenges, and currency fluctuations. Start with small test (1/10th investment, lower risk) to validate before full expansion. Success in test market accelerates full entry decision. Failed test market costs $20K to learn, avoiding $200K mistake.
Employee training investments improve productivity and retention. Calculate: Training Cost / (Productivity Increase + Turnover Cost Savings). Example: $5K training program improves productivity 20% (generating $10K additional annual profit) and reduces turnover 30% (saving $8K annual replacement costs) = $18K annual benefit, 3.3-month payback. Technical training typically has fastest payback (immediate productivity improvement). Leadership training has longer payback (12-24 months) but broader impact. Calculate payback for training programs to justify L&D budgets and prioritize highest-return training investments.
Retention program payback: Program Cost / (Churn Reduction × Customer Lifetime Value). Example: $50K annual retention program reduces churn from 5% to 4% monthly. At 1,000 customers with $500 LTV, saving 1% monthly churn saves 120 customers/year × $500 = $60K value. Payback: 10 months. Retention improvements compound: lower churn increases average customer lifetime, increasing LTV, increasing retention program ROI. Small churn reductions generate huge value at scale. Most retention programs payback within 6-12 months and continue generating value indefinitely.
Infrastructure investments have long payback but enable growth. Calculate: Infrastructure Cost / Annual Operating Cost Savings + Growth Capacity Value. Example: $100K warehouse expansion saves $15K annual outsourcing costs and enables $50K additional annual revenue (previously capacity constrained) = $65K annual benefit, 1.5-year payback. Infrastructure often has 3-5 year payback but necessary for growth. Don’t defer critical infrastructure waiting for better payback - growth opportunities might be missed. However, avoid over-investment in infrastructure before demand materializes. Phase infrastructure to match growth trajectory.
Building affiliate program has upfront and ongoing costs: software platform ($100-500/month), affiliate recruitment ($2K-10K), creative assets and tools ($3K-5K), and program management (10-20 hours/week). Calculate: Total Annual Program Cost / Annual Incremental Profit from Affiliates. Example: $30K annual program cost, affiliates drive $150K additional sales at 40% margin = $60K profit, 6-month payback. Track by cohort: early affiliates might take 6-12 months to ramp, mature program generates consistent returns. Most affiliate programs payback within 12-18 months and scale profitably thereafter. Focus early recruitment on proven affiliates for faster payback.
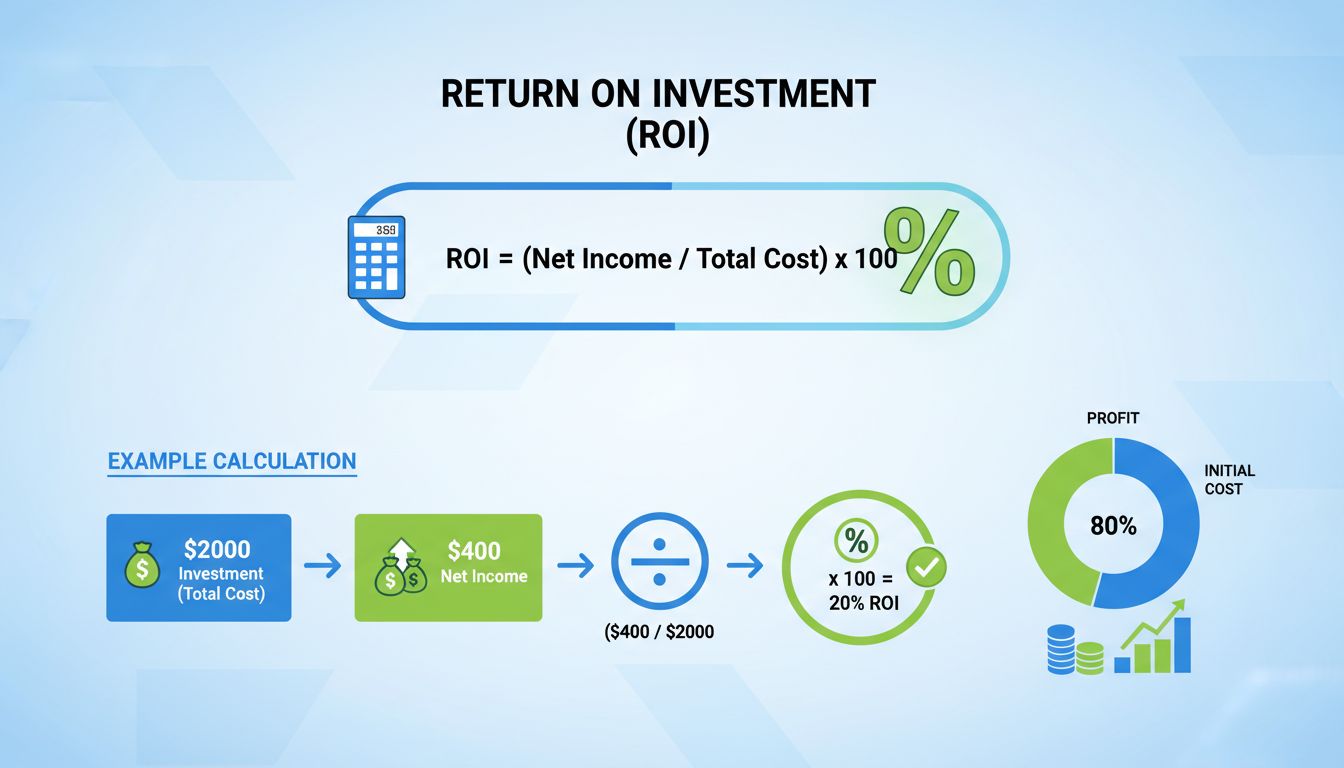
Payback period is the time required to recover an initial investment from cash inflows generated by that investment. Formula: Initial Investment / Annual Cash Inflow. Example: $50K investment generating $20K annual profit has a 2.5-year payback period. Importance: simple decision criterion (shorter is better), risk assessment tool (longer payback = more risk), cash flow planning (know when investment becomes cash-positive), and project comparison (compare multiple investment options). Businesses typically target 1-3 year payback periods. Payback period is straightforward but doesn't account for time value of money or cash flows after payback.
For uneven cash flows, use cumulative cash flow method. Track cumulative cash: Year 0: -$100K (initial investment), Year 1: -$70K (recovered $30K), Year 2: -$30K (recovered $40K), Year 3: +$20K (recovered $50K). Payback occurs partway through Year 3. Precise calculation: 2 years + ($30K remaining / $50K Year 3 cash flow) = 2.6 years. This method works for any cash flow pattern. Marketing campaigns, product launches, and expansions typically have uneven cash flows. Track actual vs. projected cash flows monthly to monitor payback progress. Adjust projections as real data emerges.
Simple payback period ignores time value of money - $1 next year equals $1 today. Discounted payback period accounts for time value by discounting future cash flows. Example: $100K investment, $40K annual cash flow, 10% discount rate. Simple payback: 2.5 years. Discounted payback: Year 1: $36.4K (discounted), Year 2: $33.1K, Year 3: $30.1K. Cumulative: $99.6K by Year 3, so payback is slightly over 3 years vs. 2.5 years simple. Use discounted payback for: long-term investments (over 3 years), high-risk investments requiring risk premium, or when comparing investments with different risk profiles. Simple payback works for short-term, low-risk investments.
Good payback periods vary by context. Small business investments: 1-2 years ideal, 3 years acceptable, over 3 years requires strong justification. Marketing campaigns: 3-6 months for short-term campaigns, 12-18 months for brand building. Equipment purchases: 2-3 years typical, faster for revenue-generating equipment. Technology investments: 1-2 years (technology changes quickly). Real estate: 5-10 years acceptable (long-term asset appreciation). SaaS customer acquisition: 12-18 months (balanced by lifetime value). Risk tolerance and company stage affect acceptable payback - startups need faster payback, established businesses can wait longer.
Payback period has significant limitations: ignores cash flows after payback (project might generate huge returns after payback period), doesn't account for time value of money (simple payback), provides no profitability measure (just break-even timing), ignores project life (1-year payback on 2-year project vs. 10-year project looks identical), and offers no risk adjustment beyond time horizon. Use payback period alongside: NPV (net present value - accounts for all cash flows and time value), IRR (internal rate of return - shows profitability percentage), ROI (return on investment - cumulative profit vs. investment). Payback answers 'how fast' not 'how profitable' - you need both perspectives.
Payback period and break-even are related but distinct. Break-even point is when cumulative revenue equals cumulative costs (accounting perspective). Payback period is when cumulative cash inflows equal initial investment (cash flow perspective). Differences: break-even includes non-cash items (depreciation, amortization), payback period focuses only on cash, break-even is ongoing (monthly break-even), payback is one-time (investment recovery). Both answer: when does this become profitable? Use break-even for: ongoing operations, pricing decisions, volume planning. Use payback for: investment decisions, project evaluation, capital budgeting. Track both for complete financial picture.
Customer acquisition payback: Customer Acquisition Cost / (Monthly Revenue per Customer × Gross Margin). Example: CAC of $300, customer pays $50/month, 70% gross margin. Payback = $300 / ($50 × 0.70) = 8.6 months. SaaS businesses target 12-18 month payback. Considerations: include all acquisition costs (marketing, sales, onboarding), use gross margin not revenue (only recoverable cash), factor in churn (some customers leave before payback), segment by channel (paid ads vs. organic have different payback), and track cohorts (payback by signup month reveals trends). Faster payback enables more aggressive growth investment.
Not necessarily. Shortest payback reduces risk and frees capital faster but might miss highest-return opportunities. Example: Project A has 1-year payback, generates $100K profit total. Project B has 3-year payback, generates $500K profit total. Project B is more profitable despite longer payback. Decision framework: when capital is constrained, favor shorter payback (reinvest recovered capital faster), when risk is high, favor shorter payback (less exposure time), when profitability is priority, use NPV or IRR instead of payback, or use payback as minimum threshold (must payback within 3 years) then evaluate finalists on profitability. Balanced approach: weight payback period and profitability based on your situation.
Affiliates make various investments with different payback periods: Content creation (blog posts, videos - payback 6-12 months as they rank and generate traffic), Paid traffic campaigns (ads - payback hours to days if profitable, immediate loss if not), SEO tools and software ($100-500/month - payback 2-4 months if improving rankings), Email marketing platform ($50-200/month - payback 1-3 months if driving conversions), and Website development ($2K-10K - payback 12-24 months). Calculate: Investment / Monthly Profit Increase. Track by investment type to identify best uses of capital. Faster-payback investments (paid traffic that works) should be scaled aggressively.
Accelerate payback by increasing cash inflows or reducing initial investment. Increase inflows: higher prices (if market accepts), higher volume (more units sold), faster sales cycle (reach customers quicker), improved conversion rates (better marketing), reduced churn (customers stay longer), upsells and cross-sells (higher customer value), and operational efficiencies (lower costs increase profit). Reduce investment: phase implementation (start smaller), lease vs. buy (lower upfront cost), negotiate better terms (deferred payments), reuse existing assets (don't buy new), partner arrangements (share costs), and grants or subsidies (reduce your investment). Even 20-30% payback acceleration significantly improves project attractiveness.
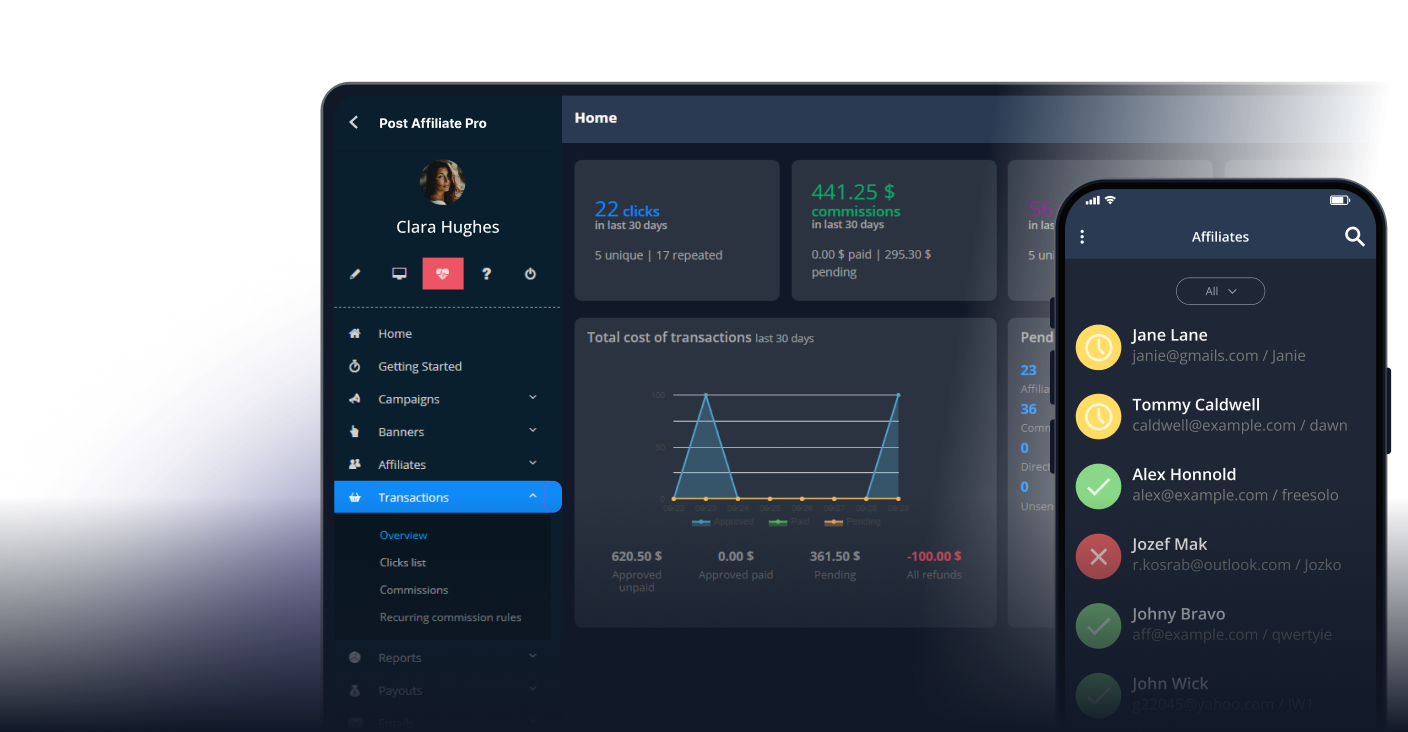
Manage multiple affiliate programs and improve your affiliate partner performance with Post Affiliate Pro.
Learn how to calculate ROI with step-by-step formulas, real-world examples, and advanced techniques. Master return on investment calculations for better financi...

Free affiliate program ROI calculator. Evaluate cost-effectiveness, calculate CPA, compare with PPC and social ads. Includes break-even analysis and lifetime va...

Calculate how long until you reach affiliate payout thresholds. Visualize your earnings timeline with support for different payment terms, commission rates, and...
Join our community of happy clients and provide excellent customer support with Post Affiliate Pro.
Cookie Consent
We use cookies to enhance your browsing experience and analyze our traffic. See our privacy policy.