Top Methods to Speed Up a Website: Performance Optimization
proven methods to speed up your website including image optimization, caching, CDN, and Core Web Vitals optimization. Improve performance and conversions today.
Learn how to check your website’s loading time using free and paid tools like Pingdom, Google PageSpeed Insights, and GTmetrix. Discover key metrics, benchmarks, and optimization strategies for 2025.
You can check your website's loading time using free tools like Google PageSpeed Insights, GTmetrix, WebPageTest, and Pingdom. These tools measure key performance metrics including Largest Contentful Paint (LCP), Interaction to Next Paint (INP), and Cumulative Layout Shift (CLS) to help you identify performance bottlenecks and areas for improvement.
Website loading time is one of the most critical factors affecting user experience, search engine rankings, and business metrics. When visitors arrive at your site, they expect it to load quickly—research shows that an ideal page load time is between 0-2 seconds, with 3 seconds being the maximum acceptable threshold. Anything above 3 seconds significantly increases the likelihood of visitors abandoning your site. Understanding how to measure and monitor your website’s loading time is essential for maintaining a competitive online presence and ensuring your audience has a positive experience interacting with your content.
Google PageSpeed Insights is one of the most popular and accessible tools for checking website loading time. Available at pagespeed.web.dev, this free tool is powered by Lighthouse and the Chrome User Experience Report (CrUX), providing both lab and field data. The tool measures Core Web Vitals—Google’s essential performance metrics—and offers actionable recommendations for improvement. PageSpeed Insights tests both mobile and desktop versions of your site, integrates seamlessly with Google Search Console, and provides insights specifically aligned with Google’s ranking factors. The main limitation is that it offers limited historical data, making it better suited for quick assessments rather than long-term performance tracking.
GTmetrix combines Lighthouse and PageSpeed metrics to provide a balanced approach to performance testing. The free plan allows you to run tests and view detailed waterfall charts showing how each element of your page loads. You’ll receive a performance grade, recommendations prioritized by impact, and video recordings of your page loading. GTmetrix tests from multiple server locations, giving you insight into how your site performs geographically. However, the free plan limits your test frequency and provides only limited historical tracking, making the paid plans more suitable for continuous monitoring.
WebPageTest (webpagetest.org) is a powerful free tool that provides highly detailed waterfall charts and advanced performance analysis. This tool excels at showing you exactly what’s happening during your page load, with features like video playback of the entire loading process, filmstrip views showing visual progression, and customizable network throttling to simulate different connection speeds. WebPageTest allows testing from multiple locations and includes comparison tools to benchmark against competitors. The trade-off is a steeper learning curve—the interface is more technical and requires more expertise to interpret results effectively.
Pingdom’s free speed test tool (tools.pingdom.com) offers a user-friendly interface perfect for beginners. It provides a simple performance grade, breaks down page size by content type, shows load time by element, and displays a waterfall view of your page load. The tool is excellent for quick checks and getting a simple overview of your site’s performance. However, the free version lacks advanced features like Core Web Vitals measurements and detailed performance analysis available in the paid version.

When checking your website’s loading time, you’ll encounter several important metrics that measure different aspects of performance. Understanding these metrics helps you identify specific areas for improvement and prioritize optimization efforts effectively.
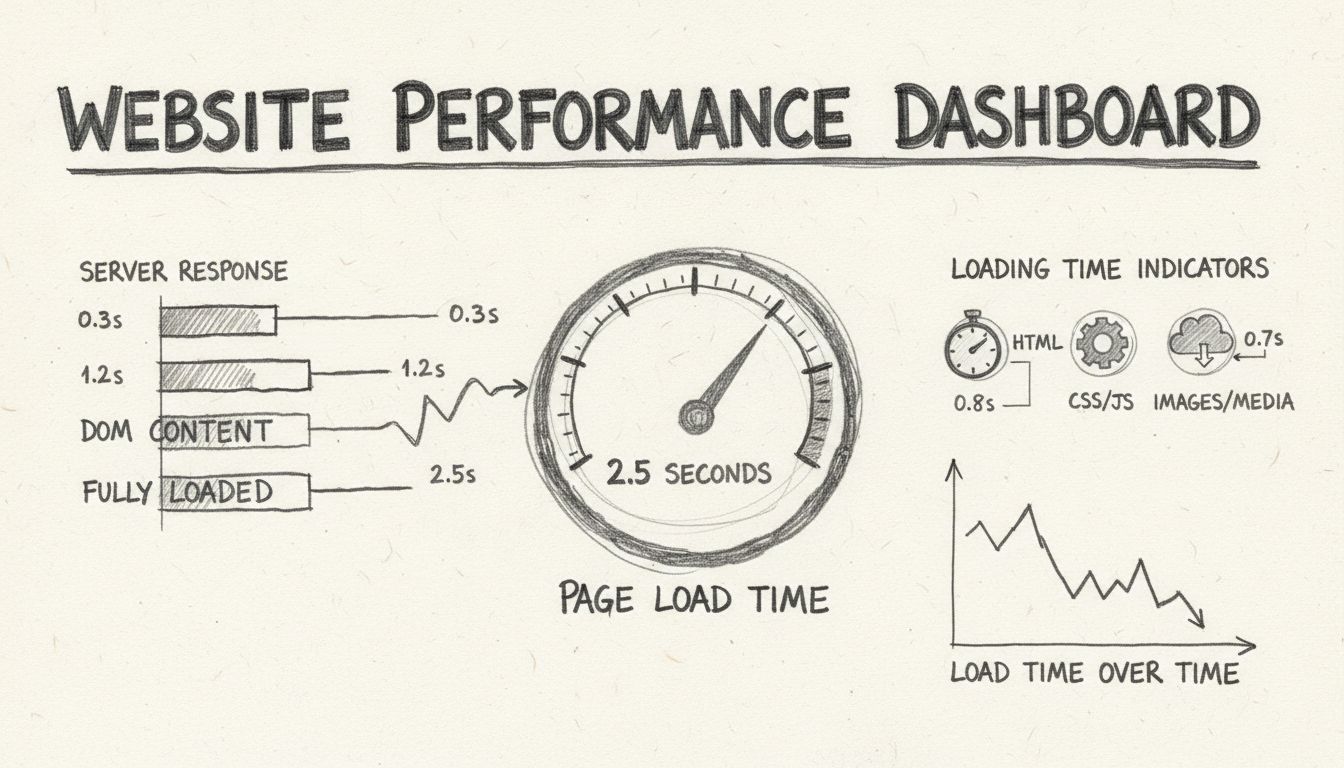
Largest Contentful Paint (LCP) measures the time when the largest visible element on your page renders. This could be a large image, text block, or video. Google considers an LCP of 2.5 seconds or less to be good, with anything above 4 seconds being poor. LCP is crucial because it indicates when users perceive the main content has loaded. Common causes of poor LCP include slow server response times, render-blocking JavaScript or CSS, slow resource loading, and client-side rendering delays. To improve LCP, optimize your server response time, remove render-blocking resources, implement lazy loading for images, use modern image formats like WebP and AVIF, and preload critical resources.
Interaction to Next Paint (INP) replaced First Input Delay in 2024 and measures the time between a user interaction (click, tap, or keypress) and the visual response. A good INP is 200 milliseconds or less, with anything above 500 milliseconds being poor. This metric reflects how responsive your page feels to user input. Poor INP typically results from long JavaScript execution, heavy DOM manipulation, unoptimized event handlers, or main thread blocking. Improve INP by breaking up long JavaScript tasks, using Web Workers for heavy computation, optimizing event handlers, reducing your JavaScript bundle size, and implementing code splitting.
Cumulative Layout Shift (CLS) measures unexpected movement of page elements during load and interaction. A good CLS score is 0.1 or less, with anything above 0.25 being poor. This metric prevents frustrating user experiences where elements move around while you’re trying to click them or read content. Common causes include images or videos without specified dimensions, ads and embeds without reserved space, dynamically injected content, web fonts causing text reflow, and animations that don’t use the CSS transform property. Optimize CLS by setting explicit dimensions for images and videos, reserving space for ads and embeds, avoiding content insertion above existing content, using CSS transforms for animations, and preloading web fonts.
For businesses requiring ongoing performance monitoring, several paid tools offer advanced features. Pingdom Premium (starting around $10/month) provides real user monitoring, synthetic monitoring from over 100 global locations, transaction monitoring, uptime monitoring, custom alerts, and API access. GTmetrix PRO (starting around $25/month) offers unlimited tests, more frequent monitoring, extended server locations, one year of historical data, API access, custom alerts, and video recording capabilities. WebPageTest Premium provides priority testing, more locations, advanced scripting, API access, and custom branding options. These premium solutions are ideal for agencies, e-commerce sites, and enterprises that need continuous performance tracking and detailed historical data.
Understanding what constitutes good performance helps you set realistic targets for your website. For e-commerce sites, where every 100 milliseconds of delay can result in approximately 1% conversion loss, target an LCP of less than 2 seconds, INP under 150 milliseconds, and CLS below 0.05. News and media sites should aim for LCP under 2.5 seconds, INP under 200 milliseconds, and CLS under 0.1. SaaS and enterprise applications typically target LCP under 2.5 seconds, INP under 200 milliseconds, and CLS under 0.1 due to productivity impacts.
Mobile performance typically runs 2-3 times slower than desktop, so adjust your expectations accordingly. Mobile LCP targets should be under 3 seconds, while desktop targets should be under 2 seconds. The overall page load time should ideally be between 2-3 seconds, with anything above 5 seconds considered poor. These benchmarks represent the 75th percentile performance, meaning 75% of users experience this speed or better—a standard Google recommends for optimization efforts.
| Metric | Excellent | Good | Needs Work | Poor |
|---|---|---|---|---|
| LCP | < 1.5s | ≤ 2.5s | 2.5-4.0s | > 4.0s |
| INP | < 100ms | ≤ 200ms | 200-500ms | > 500ms |
| CLS | < 0.05 | ≤ 0.1 | 0.1-0.25 | > 0.25 |
| TTFB | < 0.4s | ≤ 0.8s | 0.8-1.8s | > 1.8s |
| Total Page Load | < 2s | 2-3s | 3-5s | > 5s |
When you run a speed test, you’ll receive both lab data and field data. Lab data comes from synthetic testing in a controlled environment—it’s consistent and reproducible but doesn’t account for real user conditions. Field data represents actual measurements from real users and reflects genuine user experience, though it varies by device, network, and location. Both types of data are valuable: use lab data for debugging specific issues and field data for understanding real-world performance.
Pay attention to the percentile rankings in your results. Google recommends focusing on the 75th percentile, which means 75% of users experience that speed or better. This is more useful for optimization than the median (50th percentile) because it helps you identify the experience of your slower users. Waterfall charts show the sequence of resource loading and help identify bottlenecks. Look for long DNS lookup times (indicating you need a faster DNS provider), long TCP connection times (suggesting geographic distance or network issues), long server response times (requiring server optimization), and long rendering times (needing JavaScript or CSS optimization).
Server-side bottlenecks include slow Time to First Byte (TTFB), unoptimized databases, missing caching, inefficient code, and geographic distance from users. Solutions involve upgrading hosting, optimizing database queries, implementing caching layers like Redis, profiling and optimizing code, and using Content Delivery Networks (CDNs). Network bottlenecks include large payloads, too many requests, uncompressed assets, unoptimized images, and render-blocking resources. Address these by compressing assets, using modern formats, lazy loading content, enabling gzip or brotli compression, and deferring non-critical JavaScript.
Client-side bottlenecks involve large JavaScript files, long tasks blocking the main thread, inefficient DOM structures, unoptimized CSS, and blocking web fonts. Improve performance through code splitting, breaking tasks into smaller chunks, reducing DOM size, removing unused CSS, and using font-display: swap. Third-party scripts like ads, analytics, chat widgets, and tracking scripts can significantly impact performance. Manage these by lazy loading when possible, using async loading, sandboxing in iframes, and considering alternative solutions.
Start with these high-impact, low-effort optimizations that typically take 1-2 weeks to implement. Enable compression using gzip (achieving 90% reduction typical) or brotli (20% better than gzip). Optimize images by using WebP format (25-35% smaller than JPEG) or AVIF (50% smaller than JPEG), resizing to actual display size, and lazy loading below-the-fold images. Implement caching with browser caching for static assets, server-side caching for database queries, and CDN caching for global distribution. Minify CSS, JavaScript, and HTML while removing unused CSS and tree-shaking unused JavaScript. Defer non-critical JavaScript using async and defer attributes, and lazy load below-the-fold functionality.
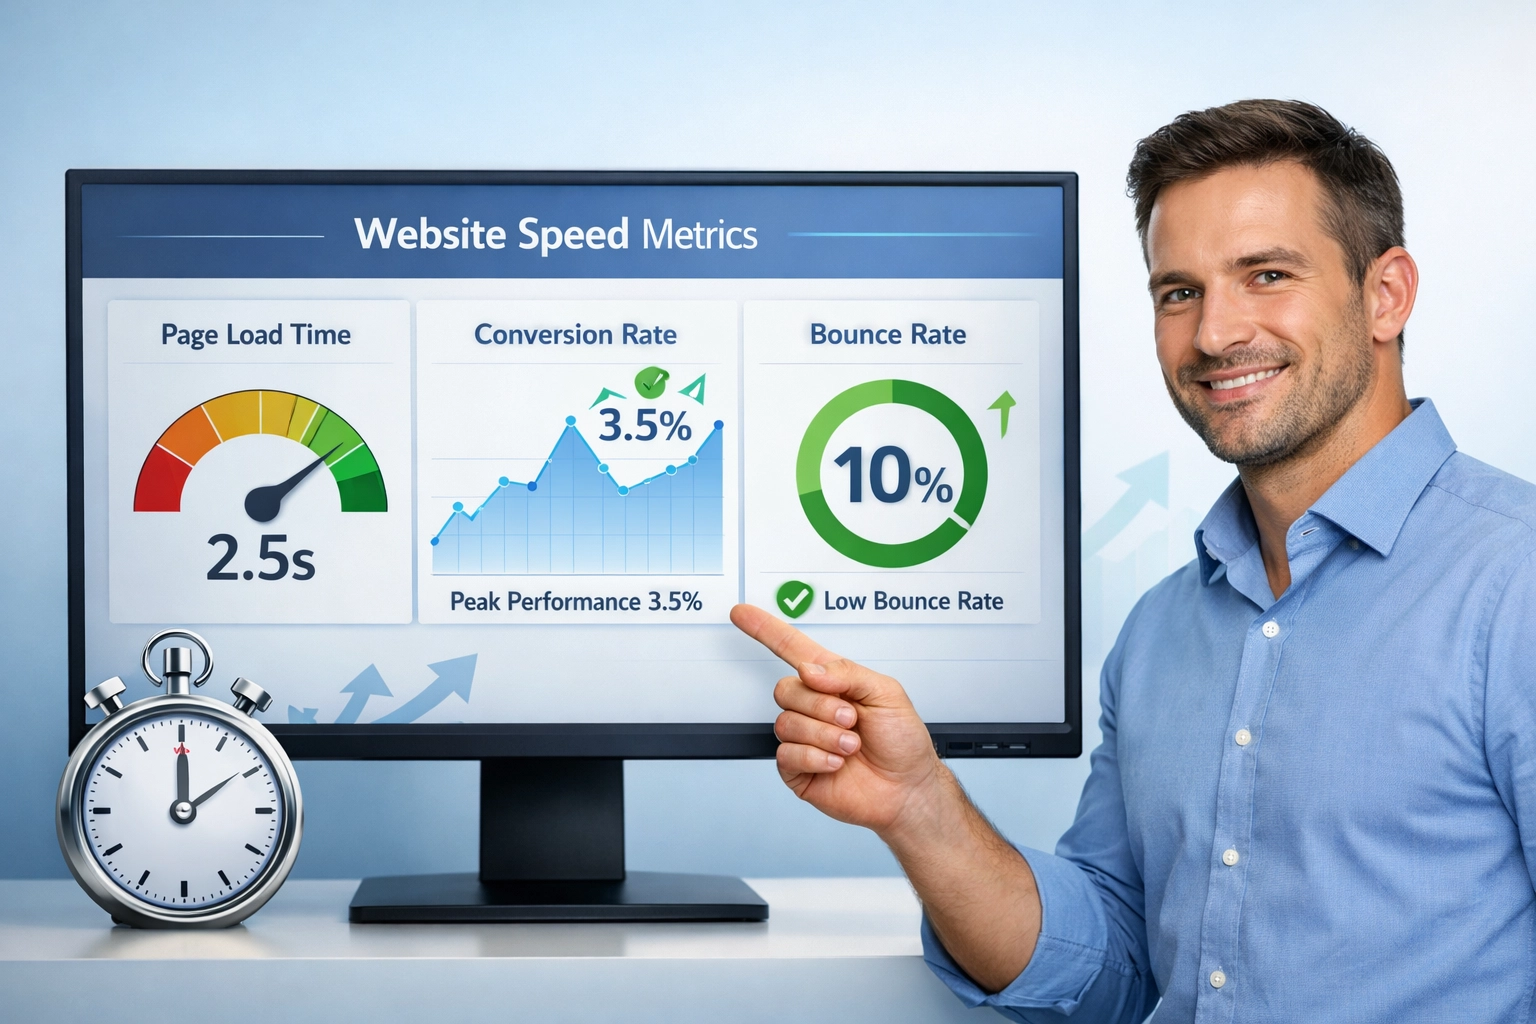
Establish a baseline by running tests on all major pages and documenting current metrics. Set realistic improvement targets based on industry benchmarks and your business goals. Prioritize improvements by focusing on Core Web Vitals first and addressing the biggest bottlenecks. Implement continuous monitoring through automated testing, tracking metrics over time, and setting up alerts for performance regressions. Measure the impact of each change and communicate the business value to stakeholders by showing improvements in conversions, bounce rate, and user engagement.
For developers, integrate performance testing into your development workflow by adding performance budgets, implementing automated testing in CI/CD pipelines, and detecting performance regressions early. Profile code regularly, test on real devices, and monitor third-party impact. Use modern tools like Chrome DevTools for debugging and Lighthouse for automated audits. Stay updated with best practices by following web.dev, monitoring Chrome updates, and participating in the performance community.
Website speed optimization is an ongoing process that requires regular measurement, data-driven decisions, continuous improvement, and stakeholder communication. By using the recommended tools and following these best practices, you can significantly improve your website’s performance and provide a better experience for your users in 2025.
Just as website speed impacts user experience, affiliate program performance directly affects your revenue. PostAffiliatePro provides real-time tracking, detailed analytics, and performance monitoring to help you maximize your affiliate marketing results. Monitor your affiliate network's performance with the same precision you'd apply to website optimization.

proven methods to speed up your website including image optimization, caching, CDN, and Core Web Vitals optimization. Improve performance and conversions today.

Speed up your website with 7 proven techniques. Reduce load times, improve user experience, and boost conversions instantly.

how website speed directly impacts conversion rates, SEO rankings, and revenue. why fast-loading websites are essential for business success and get actionable
Cookie Consent
We use cookies to enhance your browsing experience and analyze our traffic. See our privacy policy.