Affiliate Program ROI Calculator - Calculate Your Marketing ROI
Free affiliate program ROI calculator. Evaluate cost-effectiveness, calculate CPA, compare with PPC and social ads. Includes break-even analysis and lifetime va...
2 min read

Calculate return on investment for your social media marketing campaigns. Track revenue, costs, and engagement across platforms to optimize your social strategy and maximize profitability.
The Attribution Challenge - Social media ROI is notoriously difficult to calculate accurately. Customer journeys are complex: discover brand on Instagram, research on website, read reviews, compare options, purchase days or weeks later possibly from different device. Traditional last-click attribution undervalues social’s role. Solution: use multi-touch attribution to understand full customer journey, track assisted conversions (social touchpoint but conversion elsewhere), implement view-through tracking (saw ad but didn’t click, converted later), and use platform pixels (Facebook Pixel, LinkedIn Insight Tag track conversions). Accept imperfect data - directional accuracy better than paralysis from seeking perfect attribution.
Direct vs. Indirect Value - Social media generates both direct and indirect value. Direct value (easily measured): sales from social ads, leads from gated content, e-commerce transactions through social commerce. Indirect value (harder to measure): brand awareness (reach, impressions), customer service (support via social DMs), community building (engaged followers), market research (audience feedback and insights), SEO benefits (social signals, traffic), and recruiting (company culture visibility). Calculate direct ROI for budget justification. Track indirect metrics (engagement, reach, sentiment) to understand full social impact. Comprehensive social strategy optimizes both.
Investment True Cost - Social media investment extends far beyond ad spend. Total investment includes: paid advertising (platform ad spend), content creation (writing, design, video production, photography), management time (strategy, posting, community management, reporting), tools and software (scheduling, analytics, design, listening tools), training and education (courses, conferences, certifications), agency or freelancer fees, and influencer partnerships. Many businesses calculate social ROI on ad spend only, ignoring $5K-20K monthly content and management costs. This creates false ROI picture. Track all costs for honest ROI assessment.
Platform-Specific Optimization - Each platform has unique audience, content preferences, and ROI drivers. Facebook: detailed targeting, diverse ad formats, oldest user base (35-55 core), strong for e-commerce and local business. Optimize through: interest targeting, lookalike audiences, retargeting, and video content. Instagram: visual content, younger demographic (18-34 core), influencer ecosystem. Optimize through: Stories and Reels (high engagement), shopping features, influencer partnerships, and high-quality visuals. LinkedIn: B2B focus, professional content, higher CPM but quality leads. Optimize through: thought leadership content, sponsored content, InMail campaigns, and account-based targeting. TikTok: Gen Z, entertainment-first, viral potential. Optimize through: authentic content, trends and challenges, creator partnerships, and short-form video mastery.
Content ROI and Performance - Not all content delivers equal ROI. Analyze content performance by: format (video typically outperforms static images 10-15X engagement), topic (educational and entertaining content outperforms promotional), timing (post when your audience is active - varies by platform), and length (short-form video dominates most platforms currently). Track content metrics: reach (how many saw it), engagement rate (engagements / reach), click-through rate (clicks to website), and conversion rate (actions taken). Double down on high-ROI content formats and topics. Many brands waste resources on low-performing content types they “should” create rather than what their audience wants.
Funnel-Based Social Strategy - Map social tactics to funnel stages. Awareness (top of funnel): organic content, influencer partnerships, viral campaigns, broad targeting ads. Goal: reach and impressions. ROI metric: cost per 1,000 impressions. Consideration (middle funnel): educational content, product demos, case studies, interest-based targeting. Goal: engagement and website traffic. ROI metric: cost per click, time on site. Conversion (bottom funnel): retargeting ads, promotional offers, social commerce, lookalike audiences. Goal: sales and leads. ROI metric: cost per acquisition, ROAS. Most businesses over-invest in awareness and under-invest in conversion. Balanced funnel investment optimizes overall ROI.
Testing and Optimization - Social media requires continuous testing to improve ROI. Test systematically: audiences (demographics, interests, behaviors, lookalikes), creative (images, video, copy, formats), offers (discounts, value propositions, CTAs), placements (feed, Stories, Reels, Explore), and timing (days, times, duration). Implement: A/B testing on every campaign, creative refresh every 2-4 weeks (combat ad fatigue), audience exclusions (don’t pay to reach existing customers unless retargeting), and bid strategy optimization (CPC, CPM, CPA depending on objective). Continuous testing typically improves ROI 30-50% over 6-12 months compared to static campaigns.
Retargeting warm audiences generates highest social ROI - often 3-5X better than cold traffic campaigns. Install platform pixels, create audiences (website visitors, engaged video viewers, Instagram profile visitors), segment by behavior (product viewers, cart abandoners, past customers), and create specific ads (show products they viewed, address abandonment, cross-sell to customers). Set appropriate windows: 30 days for most e-commerce, 90-180 days for considered purchases, 365 days for high-ticket B2B. Layer exclusions: exclude recent purchasers, exclude current customers from acquisition campaigns, suppress converted leads. Retargeting turns awareness investment into conversion ROI.
Scale beyond existing audience using lookalike modeling. Upload customer lists, create lookalike audiences (platform finds similar users), start with 1% similarity (most similar, highest quality), and expand to 5-10% lookalikes (broader reach, lower quality but still qualified). Use multiple source audiences: high-value customers (LTV over $X), recent customers (purchased last 90 days), engaged users (video viewers, page followers), and email subscribers. Test lookalikes against interest targeting - often 20-40% better ROI. Lookalikes work best with source audience of 1,000+ people. Update regularly as customer base grows and changes.
Video content generates 5-10X more engagement than static content across all platforms. Investment: smartphone video (low cost, authentic), produced video ($500-5,000 per video), user-generated content (customer videos - free to minimal cost), and live video (unedited, real-time engagement). Format considerations: short-form (15-60 seconds for social feeds, TikTok, Reels), long-form (3-15 minutes for YouTube, educational content), and Stories (vertical, full-screen, 15-second segments). Video drives higher ROI through: longer watch time (platform algorithms favor), emotional connection (face and voice builds trust), and information density (communicate more faster). Repurpose video across platforms to maximize content ROI.
Influencer partnerships can drive strong ROI when executed well. Calculate influencer ROI: Revenue Generated / (Influencer Fee + Product Cost + Management Time). Choose influencers by: audience match (their audience = your target), engagement rate (3-6% good, over 6% excellent), authenticity (genuine followers, real engagement), and niche expertise (industry credibility). Compensation models: flat fee (predictable cost), commission (pay for performance), product exchange (lowest cost), or hybrid (fee + commission). Track with unique codes/links. Micro-influencers (10K-100K followers) often deliver better ROI than mega-influencers due to higher engagement rates and lower costs.
Sell directly on social platforms for seamless purchase experience. Platforms: Facebook/Instagram Shops (product catalogs, checkout on platform), TikTok Shopping (shoppable videos), Pinterest Shopping (visual discovery + purchase), and YouTube Shopping (product links in videos). Benefits: reduced friction (no website redirect), native checkout (platform handles payments), mobile-optimized (where users already are), and impulse purchases (easy one-click buying). Optimize: high-quality product images, detailed descriptions, competitive pricing, and customer reviews. Social commerce often shows 2-3X conversion rate versus website traffic from social ads.
Engaged communities drive long-term ROI through organic reach and customer loyalty. Build community through: consistent valuable content (not just promotional), authentic engagement (respond to comments and DMs promptly), user-generated content (share customer content, run contests), exclusive groups (Facebook Groups, Discord communities), and behind-the-scenes content (humanize brand). Benefits: organic reach (engaged followers see and share content), word-of-mouth (community members recommend), customer insights (feedback and ideas), and retention (engaged customers stay longer). Community ROI is long-term - invest 6-12 months before significant returns materialize.
Monitor brand mentions and sentiment for customer insights and issue resolution. Tools: native platform search, Google Alerts (free), paid tools (Hootsuite, Sprout Social, Brandwatch - $100-1,000+/month). Monitor: brand mentions, competitor mentions, industry keywords, and customer sentiment. Act on insights: respond to complaints quickly (prevent escalation), engage with positive mentions (build advocates), identify product issues (faster than support tickets), and discover content opportunities (what are people asking?). ROI: prevented crises (one viral complaint can cost thousands in reputation damage), improved customer satisfaction (public issue resolution), and product improvements (customer-driven enhancements).
Employees sharing company content amplifies reach authentically. Program structure: provide shareable content (make it easy), give social media training (teach best practices), track participation and impact (measure program success), and recognize top advocates (incentivize participation). Benefits: expanded reach (employee networks reach new audiences), authentic endorsement (people trust people over brands), recruitment benefits (attract talent), and low cost (mostly internal resources). ROI calculation: Reach from Employee Shares × Engagement Rate × Conversion Rate × Average Customer Value / Program Cost. Well-run programs often achieve 10-20X ROI on program investment.
Combine paid and organic strategies for amplification. Strategies: boost top-performing organic content (let organic validate, then amplify with budget), use paid to grow organic audience (run follower campaigns to expand organic reach), retarget organic engagers (people who engaged with free content, haven’t converted), and organic for ongoing community (paid for reach and acquisition). Track both channels: organic provides engagement metrics and content validation, paid provides conversion data and scale. Most successful brands use 70-30 paid-organic budget split - primarily paid for reach, supported by organic for community and content testing.
Implement comprehensive tracking to understand true social ROI. Setup: install all platform pixels, implement UTM parameters consistently, set up conversion tracking, use Google Analytics 4 multi-touch attribution, and integrate CRM for lead tracking. Analyze: last-click attribution (conservative baseline), first-click attribution (social’s awareness role), linear attribution (equal credit all touchpoints), time-decay attribution (recent touchpoints weighted higher), and position-based attribution (first and last weighted more). Report: direct conversions (last-click social), assisted conversions (social in journey but not last touch), and view-through conversions (saw ad, didn’t click, converted later). Comprehensive attribution shows social typically drives 30-50% more value than last-click alone reveals.
Social Media ROI = ((Revenue - Investment) / Investment) × 100. Example: spent $5,000 on social ads and content creation, generated $20,000 in attributed sales, ROI = (($20,000 - $5,000) / $5,000) × 100 = 300% ROI. Include all costs: ad spend, content creation (time or agency fees), tools and software (scheduling, analytics), staff time, and influencer partnerships. Attribute revenue using: UTM tracking, promo codes, social commerce transactions, or multi-touch attribution. Challenges: long sales cycles (social drives awareness, conversion happens later), multi-touch journeys (social assists but doesn't close), and brand value (awareness hard to quantify). Track both direct ROI and assisted conversions.
Include comprehensive costs: Paid advertising (Facebook Ads, Instagram Ads, LinkedIn Ads, TikTok Ads), content creation (copywriting, graphics, video production, photography - $500-5,000/month), management time (strategy, posting, engagement, analytics - calculate hours × rate), tools and software (Hootsuite, Buffer, Canva, analytics - $50-500/month), influencer partnerships ($100-100,000+ per campaign), employee or agency costs (social media manager salary or agency retainer), and training and development. Many businesses only count ad spend, drastically overstating ROI. True social media investment often 2-3X reported ad spend when including content and labor.
Good ROI varies by platform, industry, and objective. Direct response campaigns (e-commerce, lead gen): 200-500% ROI typical, 1,000%+ achievable with optimization. Brand awareness campaigns: harder to measure directly, track cost per impression/engagement. B2B LinkedIn: $5-10 cost per lead (higher cost, higher value leads). E-commerce Facebook/Instagram: 300-800% ROI with retargeting. Average across industries: 250-400% ROI for mature social programs. New programs often show negative ROI initially (investment phase), improving to positive after 6-12 months. Don't expect immediate returns - social requires consistent investment before ROI materializes.
Attribution methods: UTM parameters in all links (track source/medium/campaign), platform conversion tracking (Facebook Pixel, LinkedIn Insight Tag), unique promo codes per platform (FACEBOOK10, INSTA15), social commerce transactions (direct Instagram/Facebook shop sales), CRM tracking (ask customers how they found you), or multi-touch attribution (Salesforce, HubSpot, Google Analytics 4). Challenges: cross-device journeys (discover on mobile, purchase on desktop), attribution window (30-day default might miss long sales cycles), and assisted conversions (social touchpoint early in journey). Use last-click as conservative baseline, then analyze multi-touch to understand full social impact.
Engagement has value but calculating it is complex. Methods: Cost per engagement (ad spend / total engagements - benchmark $0.05-0.50 depending on platform and content), engagement rate (engagements / reach × 100 - compare to industry average), or calculated engagement value (estimate percentage who engage then convert × average order value). Example: 1,000 likes, historical data shows 2% of engagers eventually convert, $100 average order value, engagement value = 1,000 × 0.02 × $100 = $2,000. This requires historical data linking engagement to conversion. Most businesses track engagement separately from direct ROI - engagement indicates audience health and content performance.
Organic social (unpaid posts) has lower direct costs but significant time investment. Calculate organic ROI: Revenue from Organic / (Content Creation Time + Management Time + Tools) × Rate. Often shows lower ROI due to declining organic reach (Facebook organic reach 5-6%, Instagram 10-15%). Paid social has clear spend and attribution but can be expensive. Hybrid approach works best: use organic for community building and engagement, use paid for reach and conversions, repurpose organic content as paid ads (reduce content costs), and boost top-performing organic content. Most successful brands spend 70-80% budget on paid, 20-30% on organic content.
ROI timeline varies by strategy and industry. Immediate (0-30 days): retargeting campaigns (warm audience), promotional campaigns with clear offers. Short-term (1-3 months): lead generation campaigns, e-commerce with optimized funnel. Medium-term (3-6 months): brand building, content marketing, organic growth. Long-term (6-12+ months): thought leadership, community building, enterprise B2B. Don't expect immediate returns from organic social - it requires 6-12 months of consistent posting to build audience and establish presence. Paid social shows results faster (days to weeks) but still needs testing and optimization period (4-8 weeks) before hitting optimal ROI.
Platform ROI depends on your audience, product, and goals. Facebook: broad reach, excellent targeting, proven for e-commerce (300-800% ROI typical). Instagram: visual products, younger demographics, strong influencer ecosystem (400-600% ROI). LinkedIn: B2B marketing, professional services, higher cost but quality leads ($5-15 CPL vs. $1-3 Facebook). TikTok: Gen Z audience, entertainment/viral content, newer ad platform (500-1,000% ROI for right brands). Twitter/X: news, tech, real-time engagement (lower direct ROI, good for brand building). YouTube: long-form content, tutorials, high production value (strong ROI for educational content). Test platforms your audience uses - targeting matters more than platform.
B2B social has longer sales cycles and higher values. B2B characteristics: 3-12 month sales cycles (multiple touchpoints), high customer values ($10K-$1M+), decision committees (multiple stakeholders), LinkedIn dominates (professional network), content focus (thought leadership, whitepapers), and relationship-driven (networking, trust-building). ROI measurement: cost per lead, lead quality, pipeline value, sales cycle length. B2C characteristics: shorter cycles (days to weeks), lower values ($10-$500), impulse purchases, visual platforms (Instagram, TikTok, Facebook), promotional content, and transaction-focused. ROI measurement: cost per acquisition, conversion rate, immediate ROAS. B2B requires patience - track pipeline influence not just direct conversions.
Social media is powerful affiliate traffic source but attribution is challenging. Strategies: social media drives traffic to affiliate content (blog posts, reviews, comparisons with affiliate links), use link-in-bio tools (Linktree, Beacons) for trackable affiliate links, create social-exclusive promo codes (track affiliate conversions by code), build engaged community (higher click-through to affiliate offers), leverage platform features (Instagram Stories swipe-up, YouTube description links), and track social-referred sessions in Google Analytics (see conversion paths). Calculate affiliate social ROI: Commission Revenue from Social Traffic / Social Media Investment. Social works best for affiliate marketing when: you build audience trust, promote relevant products, provide genuine value, and track attribution carefully.
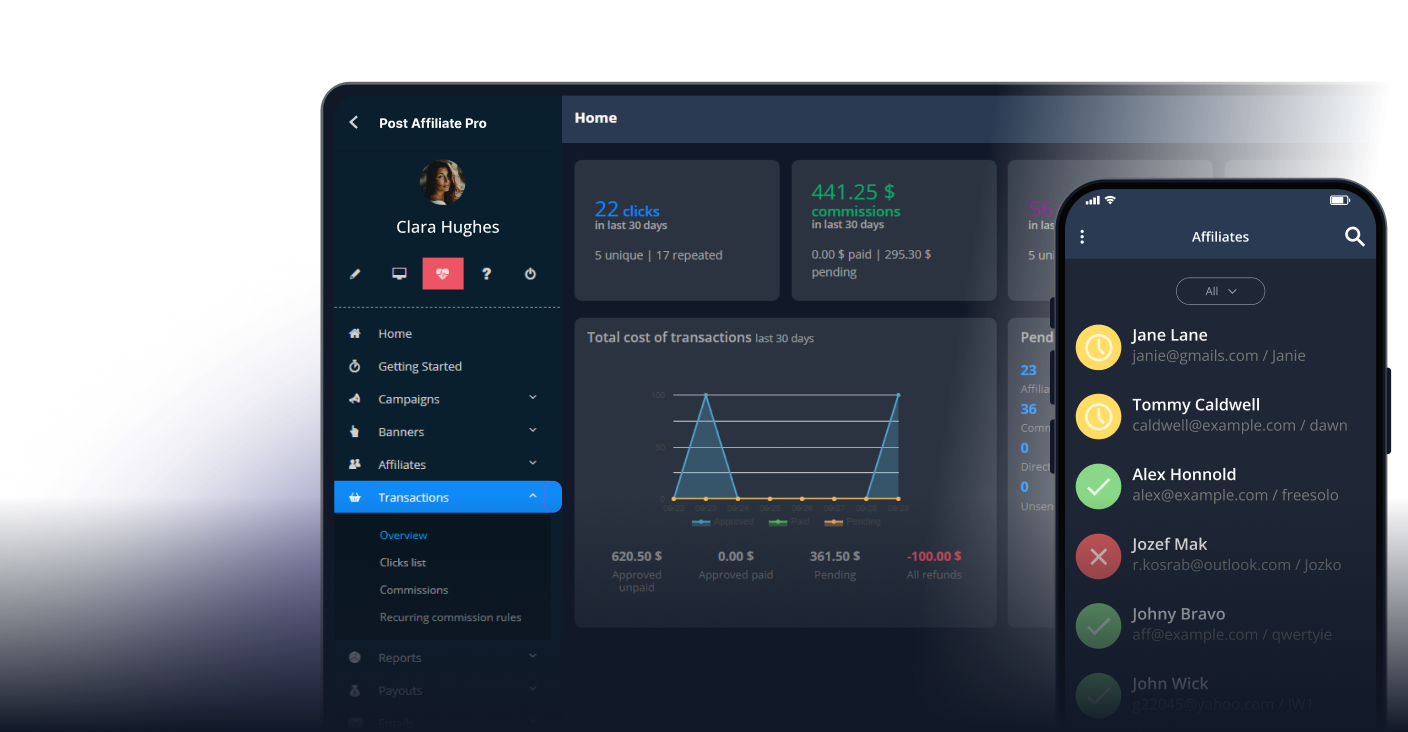
Manage multiple affiliate programs and improve your affiliate partner performance with Post Affiliate Pro.
Free affiliate program ROI calculator. Evaluate cost-effectiveness, calculate CPA, compare with PPC and social ads. Includes break-even analysis and lifetime va...
Return on investment (ROI) is a measure used to determine the profitability of your investments. It provides valuable insight into money efficiency, especially ...

Free email marketing ROI calculator to measure campaign profitability, analyze cost per acquisition, and optimize email strategy. Calculate revenue, costs, and ...
Join our community of happy clients and provide excellent customer support with Post Affiliate Pro.