Conversion Rate Calculator - Calculate & Optimize Conversion Rates
Free conversion rate calculator for simple rates, funnel analysis, and A/B testing. Optimize conversions, identify bottlenecks, and improve marketing ROI.
6 min read

Calculate landing page performance metrics including conversion rates, revenue per visitor, and ROI. Analyze traffic, conversions, and revenue to optimize your landing pages for maximum results.
Conversion Rate Fundamentals - Conversion rate is the percentage of visitors who complete your desired action. Calculate: (Conversions / Visitors) × 100. A 3% conversion rate means 3 out of 100 visitors convert. This seemingly small number has massive impact - improving from 2% to 3% increases conversions by 50% without additional traffic. Track conversion rate as primary success metric, but also monitor micro-conversions (scroll depth, video views, link clicks) that indicate engagement and predict eventual conversion. Conversion optimization is typically more cost-effective than traffic acquisition.
Revenue Per Visitor - This metric combines traffic, conversion rate, and average order value into single efficiency measure. Calculate: (Total Revenue / Total Visitors) or (Conversion Rate × Average Order Value). Example: 3% conversion rate × $100 AOV = $3 revenue per visitor. If traffic costs $2 per visitor, you’re profitable. If traffic costs $4 per visitor, you’re losing money. Revenue per visitor immediately shows landing page profitability and guides traffic acquisition spending. Increase revenue per visitor through: higher conversion rates, higher average order values, or both.
Traffic Quality vs. Quantity - Not all traffic is equal. 1,000 highly-targeted visitors convert better than 10,000 untargeted visitors. Measure traffic quality by: source (organic search, paid ads, social media), intent (navigational, informational, transactional), demographics (age, location, device), and behavior (time on page, pages per session, return visits). High-quality traffic has higher conversion rates, lower bounce rates, and higher engagement. Focus traffic acquisition on quality sources even if cost per visitor is higher - conversion rate often more than compensates.
Message Match Principle - The most common conversion killer is message mismatch between traffic source and landing page. If your ad promises “50% off running shoes” but landing page shows full catalog, conversions suffer. Message match rules: headline should match ad copy closely, visual should reflect ad creative, offer should be identical to advertisement, and page should deliver on specific promise made. Test message match by tracking conversion rates by traffic source - significantly lower conversion from one source indicates message mismatch requiring page or ad adjustment.
Above-the-Fold Optimization - Visitors decide whether to engage within 3-8 seconds. Above-the-fold content (visible without scrolling) must immediately communicate: who you’re for (target audience), what you offer (clear value proposition), why they should care (benefit-focused headline), and what to do next (prominent CTA). Optimize above-fold: use benefit-driven headline (not clever or vague), include visual that reinforces message (hero image or video), place primary CTA prominently (contrasting color, large size), minimize distractions (remove navigation, sidebar, unnecessary links), and ensure mobile optimization (most traffic views on phones).
Psychology-Based Tactics - Leverage behavioral psychology to increase conversions. Scarcity (limited time offers, low stock warnings), urgency (countdown timers, expiring discounts), social proof (testimonials, user counts, ratings), authority (expert endorsements, certifications, awards), reciprocity (free valuable content before asking), and loss aversion (emphasize what they’ll lose by not acting). Implement ethically - fake scarcity destroys trust. Real scarcity converts because it triggers genuine FOMO. Test each element individually to measure impact. Combining multiple psychological triggers can increase conversions 30-50%.
Mobile-First Design - With 60-70% mobile traffic, mobile optimization is mandatory not optional. Mobile optimization: single-column layout (no complex multi-column designs), large tap targets (minimum 44×44 pixels for buttons), minimal form fields (typing on mobile is friction), fast loading (under 3 seconds critical on mobile), prominent CTA (thumb-friendly position), simplified copy (mobile users scan, don’t read), and vertical scrolling (natural mobile behavior). Test on actual devices (iPhone, Android, tablets) not just browser resize. Mobile-optimized pages often see 40-60% conversion rate improvement on mobile traffic.
Headlines are the most important page element - visitors read headlines first and decide whether to continue. Effective headline formulas: Benefit-focused (“Lose 10 Pounds in 30 Days Without Starving”), Problem-solution (“Tired of Slow Websites? Our Hosting Loads in Under 1 Second”), Question format (“Want to Double Your Conversion Rate?”), How-to (“How to Generate 1000 Leads Per Month”), Number-based (“7 Ways to Reduce Cart Abandonment by 50%”). Test multiple headlines - 20-30% conversion improvement from headline alone is common. Use power words (proven, guaranteed, effortless, instant) and avoid vague corporate speak.
Trust is prerequisite for conversion, especially with cold traffic. Implement comprehensive trust signals: Customer testimonials (specific, with names and photos), case studies (detailed success stories with metrics), client logos (recognized brands build credibility), security badges (SSL, payment security, industry certifications), guarantees (money-back, satisfaction, no-risk trial), ratings and reviews (aggregate scores and detailed reviews), media mentions (as featured in…), award badges (industry recognition), and privacy assurance (clear data handling explanation). Position trust signals near conversion points - visitors seek reassurance before committing.
Forms are conversion bottlenecks - optimize ruthlessly. Best practices: minimize fields (only ask essential information), use inline validation (real-time feedback on errors), implement smart defaults (pre-fill when possible), show progress indicators (for multi-step forms), use descriptive button text (“Get My Free Guide” not “Submit”), place labels above fields (easier to scan), design mobile-friendly inputs (appropriate keyboards, date pickers), reduce perceived effort (make optional fields clearly optional), and provide clear value reminder near submit (what they’ll get). Test form length extensively - sometimes fewer fields dramatically increases conversions.
Video can increase conversion rates 80-86% when done right. Effective landing page videos: keep under 2 minutes (attention span limits), start with hook (first 5 seconds critical), demonstrate product/service (show don’t tell), include human element (people connect with people), add captions (many watch without sound), place strategically (often above fold or middle page), autoplay muted (or give clear play prompt), and include CTA (what to do after watching). Test video vs. static images - video doesn’t always win but often does for complex products requiring explanation or emotional connection.
CTA button design significantly impacts conversions. Color psychology: Red (urgency, excitement), Orange (enthusiasm, action), Green (growth, health, go), Blue (trust, stability, calm), Yellow (optimism, warning), Purple (luxury, creativity). Test colors against your specific audience - no universal best color. CTA design elements: contrasting color (stands out from page), large size (easily clickable, especially mobile), white space around button (draws attention), action-oriented text (start with verb - “Get,” “Start,” “Download”), and first-person language (“Start My Free Trial” vs. “Start Your Free Trial”). Button copy can impact conversion 20-30%.
Social proof is powerful conversion driver. Implementation strategies: quantity (5,000 customers served, 50,000 downloads), quality (Fortune 500 clients, celebrity endorsements), recency (testimonial from this week shows current satisfaction), specificity (detailed metrics not vague praise), diversity (various customer types see themselves represented), visual elements (photos and videos more credible than text), and context-appropriate placement (relevant testimonials near related features). Rotate social proof to test effectiveness - some testimonials resonate more than others. Video testimonials often outperform text 2-3X but require more effort to create.
Capture abandoning visitors with exit-intent popups triggered when users move to close tab. Effective exit-intent strategies: compelling offer (discount, free resource, bonus), address objection (FAQ, guarantee, trial offer), create urgency (limited time offer), collect email (even if they don’t convert now), show social proof (last chance to join others), keep design simple (easy decision), make dismissal easy (don’t annoy), and segment offers (different popup for different pages/traffic). Exit-intent can recover 10-15% of abandoning visitors. However, overuse creates negative experience - use sparingly on high-value traffic.
Systematic testing compounds improvements over time. Testing process: formulate hypothesis (based on data, not hunches), create variation (change one element only), determine sample size (need statistical significance), run to completion (don’t stop tests early), analyze results (conversion rate and statistical confidence), implement winner, and iterate (test next element). Common mistakes: testing multiple elements simultaneously (can’t identify cause), stopping tests too early (false positives), not achieving statistical significance (need 95%+ confidence), and testing low-impact elements (focus on high-impact first). Continuous testing improves conversions 20-40% annually.
Personalized landing pages convert 2-5X better than generic pages. Personalization tactics: geographic (show local pricing, language, examples), demographic (age, gender-appropriate content and images), behavioral (show products they viewed, address cart abandonment), traffic source (match message to referring site/ad), device (mobile vs. desktop experiences), returning visitor (acknowledge previous visit, pick up where left off), and firmographic (B2B - company size, industry-specific messaging). Start simple with source-based personalization, add sophistication over time. Landing page builders like Unbounce, Instapage offer built-in personalization features.
Establish systematic optimization schedule. Monthly activities: review performance metrics (conversion rate trends, traffic quality), identify underperforming elements (low CTR, high bounce rate), launch 2-3 A/B tests (focus on high-impact elements), analyze completed tests (implement winners), and update copy/offers seasonally (remain relevant). Quarterly activities: comprehensive page audit (everything still working?), competitor analysis (what are they doing?), user testing (watch real users interact), and heat mapping review (where do users click, scroll?). Annual activities: complete page redesign evaluation (major refresh vs. incremental), technology stack review (tools still optimal?), and conversion funnel analysis (entire customer journey). Consistent optimization beats sporadic efforts.
Average landing page conversion rates range 2-5%, but vary significantly by industry and traffic source. Lead generation pages: 5-15% (free resources, newsletter signups), E-commerce product pages: 1-3% (purchase conversions), SaaS trial signups: 5-10%, Webinar registrations: 20-40%, and High-ticket B2B: 1-5%. Top-performing landing pages achieve 20-40%+ conversion rates through exceptional optimization. Compare your conversion rate to industry benchmarks and your own historical data. Even a 1-2 percentage point improvement can dramatically increase revenue.
Landing Page ROI = (Revenue Generated - Page Costs) / Page Costs × 100. Calculate revenue: Visitors × Conversion Rate × Average Order Value. Calculate costs: traffic acquisition cost (ad spend, SEO investment), page development (design, copywriting, development time), tools (landing page builder, A/B testing software), and ongoing optimization. Example: 10,000 visitors at $2 CPC = $20,000 cost, 3% conversion rate × $100 AOV = $30,000 revenue, ROI = ($30,000 - $20,000) / $20,000 × 100 = 50%. Track ROI to justify optimization investment.
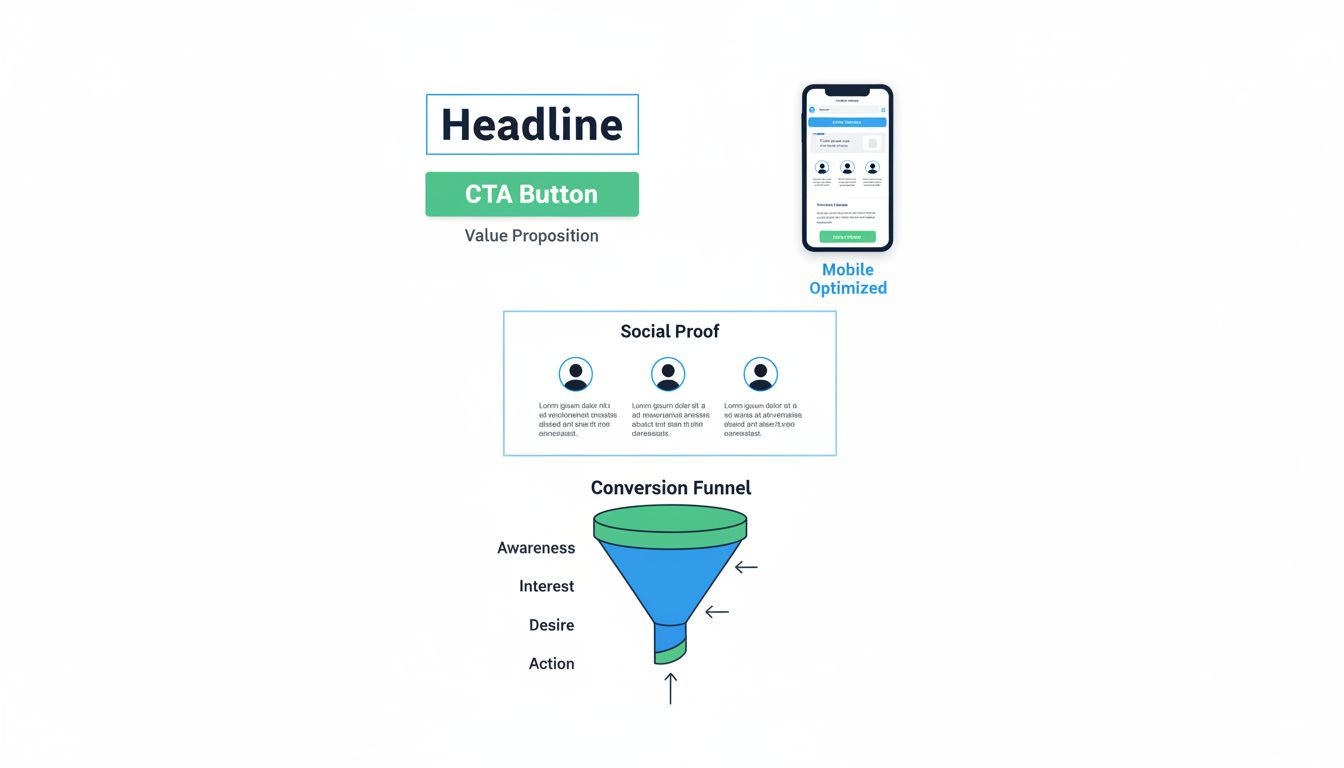
Critical conversion elements: Headline (first thing visitors see - must grab attention and communicate value), Hero image/video (visual reinforcement of message), Clear value proposition (why should they convert - unique benefit), Strong CTA (prominent, action-oriented button), Social proof (testimonials, reviews, trust badges, customer logos), Benefit-focused copy (outcomes not features), Minimal friction (few form fields, fast loading, easy navigation), Mobile optimization (60%+ traffic is mobile), and Trust signals (security badges, guarantees, privacy policy). Test each element systematically to identify your biggest opportunities.
It depends on product complexity and visitor awareness. Short-form (above fold only): works for simple offers, high-awareness traffic (they know they want it), low-commitment actions (email signup, free trial), impulse purchases, and returning visitors. Long-form (multiple screens): works for complex products requiring explanation, cold traffic needing education, high-commitment decisions (expensive, long-term), B2B purchases requiring justification, and new/innovative products. Test both formats - surprising results are common. Many assume short converts better, but long-form often wins for considered purchases.
Fewer fields typically improve conversion rates. Each additional field reduces conversions 5-10% on average. Optimal approach: ask for minimum information needed to qualify lead (name and email often sufficient), use progressive profiling (collect more information over time), make fields optional when possible, use smart defaults and auto-fill, and consider multi-step forms (break into screens - feels less overwhelming). B2B exception: more fields can improve lead quality by filtering unqualified prospects. Test field count for your specific audience - sometimes more fields paradoxically improve conversion by increasing perceived value.
Page speed dramatically affects conversions. For every 1 second delay: conversion rates drop 7%, page views decrease 11%, and customer satisfaction falls 16%. Mobile is even more sensitive - 53% of mobile users abandon pages taking over 3 seconds to load. Speed optimization tactics: compress images (use WebP format, lazy loading), minimize JavaScript and CSS (combine and minify files), use CDN for asset delivery, enable browser caching, optimize web fonts, and eliminate render-blocking resources. Target under 3 seconds load time, ideally under 2 seconds. Even 0.1 second improvements matter at scale.
Bounce rate (visitors leaving without interaction) indicates message-match problems or poor experience. Reduction strategies: match page message to traffic source (if ad promises X, page must deliver X immediately), improve above-fold content (capture attention in first 3 seconds), simplify page design (remove distractions, focus attention on conversion goal), speed up load times (bounce rate spikes above 3 seconds), optimize for mobile (60%+ of traffic), use compelling headlines (clear value proposition), add engaging visuals (video can reduce bounce 40-60%), and implement exit-intent popups (last chance to capture abandoning visitors). Target bounce rate under 40% for paid traffic.
Prioritized testing roadmap: 1) Headline variations (biggest potential impact), 2) CTA button (text, color, size, placement), 3) Hero image/video (visual appeal and message reinforcement), 4) Form length (number of fields), 5) Social proof placement and quantity, 6) Copy length (short vs. long-form), 7) Pricing display (show price vs. hide until later), 8) Page layout (single column vs. multi-column), 9) Trust signals (placement and types), 10) Color scheme and design elements. Run one test at a time with statistical significance (minimum 100 conversions per variation). Even 10-20% conversion improvement from testing compounds significantly over time.
Landing pages are critical for affiliate success: Pre-sell pages warm traffic before sending to merchant (increases conversion, some networks allow this), bridge pages educate audience about product benefits, comparison pages review multiple options (position your affiliate choice as best), bonus pages offer exclusive bonuses for purchasing through your link, and email capture pages build owned audience (promote to them repeatedly). Affiliates with landing pages typically earn 2-5X more than those direct-linking because you control message, build trust, and can optimize conversion. However, check affiliate program terms - some prohibit intermediary pages.
Essential metrics: Conversion rate (primary goal completion), Micro-conversions (scroll depth, video views, time on page), Traffic sources (which channels convert best), Bounce rate (immediate exits), Average time on page (engagement indicator), Click-through rate on CTA (visibility and appeal), Form abandonment rate (where do users drop off), Revenue per visitor (traffic × conversion rate × AOV), Cost per acquisition (traffic cost / conversions), and Return visitor conversion rate (typically 2-3X higher than first visit). Track by device, traffic source, and time period. Segment analysis reveals optimization opportunities aggregate numbers hide.
Manage multiple affiliate programs and improve your affiliate partner performance with Post Affiliate Pro.
Free conversion rate calculator for simple rates, funnel analysis, and A/B testing. Optimize conversions, identify bottlenecks, and improve marketing ROI.
Learn proven strategies to optimize landing pages for higher conversions. Discover best practices for design, copywriting, CTAs, forms, and testing with PostAff...

Learn how to calculate conversion rate with our comprehensive guide. Discover the formula, calculation methods, industry benchmarks, and optimization strategies...
Join our community of happy clients and provide excellent customer support with Post Affiliate Pro.